ACM Human Factors in Computing Systems (CHI), 2011
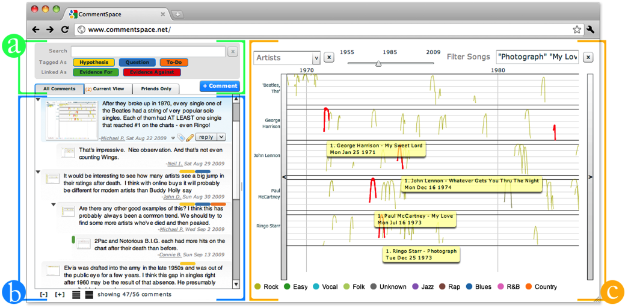
CommentSpace provides a threaded discussion area with search and filtering controls (a, b) alongside an interactive visualization (c). This visualization shows data from the Billboard Hot 100 chart – the current view shows the rise and fall of all top 100 hits from 1964 to 1980 by members of the Beatles. Color-coded bars on comments indicate tags and links (e.g. hypothesis, evidence-for, etc).
Abstract
Collaborative visual analysis tools can enhance sensemaking by facilitating social interpretation and parallelization of effort. These systems enable distributed exploration and evidence gathering, allowing many users to pool their effort as they discuss and analyze the data. We explore how adding lightweight tag and link structure to comments can aid this analysis process. We present CommentSpace, a collaborative system in which analysts comment on visualizations and websites and then use tags and links to organize findings and identify others' contributions. In a series of studies comparing CommentSpace to a system without support for tags and links, we find that a small, fixed vocabulary of tags (question, hypothesis, to-do) and links (evidence-for, evidence-against) helps analysts more reliably locate evidence and establish common ground. We also demonstrate that tags and links can help teams complete evidence gathering and synthesis tasks and that organizing comments using tags and links improves analytic results. Finally, we find that managing and incentivizing participation is important for analysts to progress from exploratory analysis to the organization and synthesis tasks where tags and links are most useful.
Citation
Video