IEEE Trans. Visualization & Comp. Graphics (Proc. InfoVis), 2016
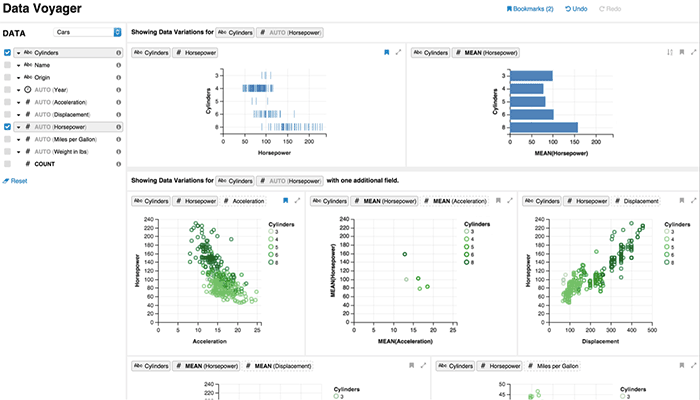
Voyager: a recommendation-powered visualization browser. The schema panel (left) lists data variables selectable by users. The main gallery (right) presents suggested visualizations of different variable subsets and transformations.
Abstract
General visualization tools typically require manual specification of views: analysts must select data variables and then choose which transformations and visual encodings to apply. These decisions often involve both domain and visualization design expertise, and may impose a tedious specification process that impedes exploration. In this paper, we seek to complement manual chart construction with interactive navigation of a gallery of automatically-generated visualizations. We contribute Voyager, a mixed-initiative system that supports faceted browsing of recommended charts chosen according to statistical and perceptual measures. We describe Voyager’s architecture, motivating design principles, and methods for generating and interacting with visualization recommendations. In a study comparing Voyager to a manual visualization specification tool, we find that Voyager facilitates exploration of previously unseen data and leads to increased data variable coverage. We then distill design implications for visualization tools, in particular the need to balance rapid exploration and targeted question-answering.
Materials
Citation
Video