IEEE Trans. Visualization & Comp. Graphics (Proc. VIS), 2022
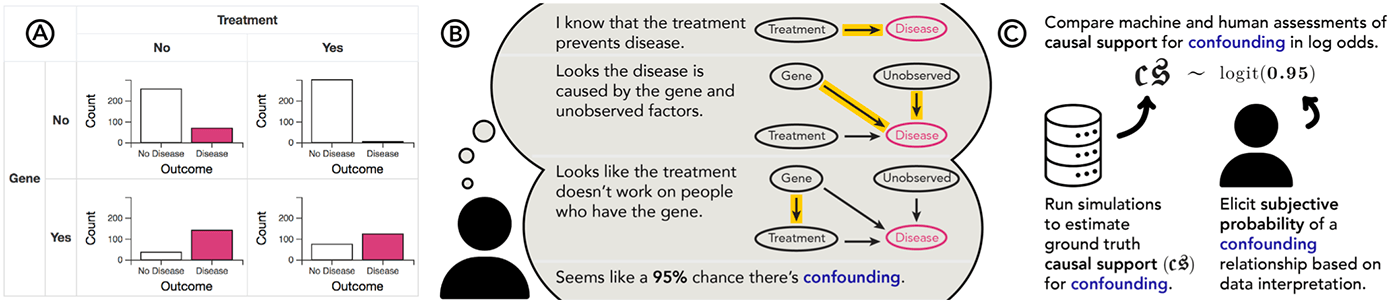
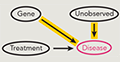
Modeling causal inferences with visualizations: (A) Users view and may interact with data visualizations; (B) Ideally, users reason through a series of comparisons that allow them to allocate subjective probabilities to possible data generating processes; and (C) We elicit users’ subjective probabilities as a Dirichlet distribution across possible causal explanations and compare these causal inferences to a computed benchmark of causal support, which we derive from Bayesian inference across possible causal models.
Abstract
Analysts often make visual causal inferences about possible data-generating models. However, visual analytics (VA) software tends to leave these models implicit in the mind of the analyst, which casts doubt on the statistical validity of informal visual "insights". We formally evaluate the quality of causal inferences from visualizations by adopting causal support — a Bayesian cognition model that learns the probability of alternative causal explanations given some data — as a normative benchmark for causal inferences. We contribute two experiments assessing how well crowdworkers can detect (1) a treatment effect and (2) a confounding relationship. We find that chart users' causal inferences tend to be insensitive to sample size such that they deviate from our normative benchmark. While interactively cross-filtering data in visualizations can improve sensitivity, on average users do not perform reliably better with common visualizations than they do with textual contingency tables. These experiments demonstrate the utility of causal support as an evaluation framework for inferences in VA and point to opportunities to make analysts’ mental models more explicit in VA software.
Materials
PDF | Supplement | Preregistration (1) | Preregistration (2) | BibTeX | Best Paper Honorable Mention
Citation