Abstract
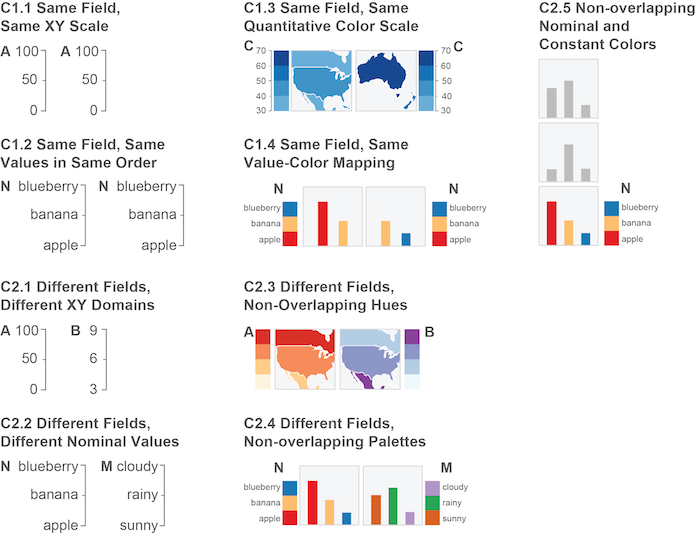
Visualizations often appear in multiples, either in a single display (e.g., small multiples, dashboard) or across time or space (e.g., slideshow, set of dashboards). However, existing visualization design guidelines typically focus on single rather than multiple views. Solely following these guidelines can lead to effective yet inconsistent views (e.g., the same field has different axes domains across charts), making interpretation slow and error-prone. Moreover, little is known how consistency balances with other design considerations, making it difficult to incorporate consistency mechanisms in visualization authoring software. We present a wizard-of-oz study in which we observed how Tableau users achieve and sacrifice consistency in an exploration-to-presentation visualization design scenario. We extend (from our prior work) a set of encoding-specific constraints defining consistency across multiple views. Using the constraints as a checklist in our study, we observed cases where participants spontaneously maintained consistent encodings and warned cases where consistency was overlooked. In response to the warnings, participants either revised views for consistency or stated why they thought consistency should be overwritten. We categorize participants’ actions and responses as constraint validations and exceptions, depicting the relative importance of consistency and other design considerations under various circumstances (e.g., data cardinality, available encoding resources, chart layout). We discuss automatic consistency checking as a constraint-satisfaction problem and provide design implications for communicating inconsistencies to users.
