ACM Human Factors in Computing Systems (CHI), 2017
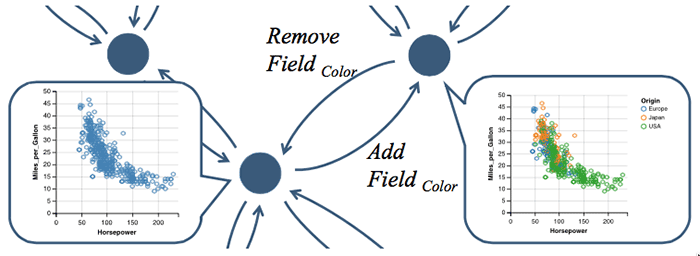
A GraphScape model. Nodes represent Vega-Lite chart specifications, edges represent edit modifications between charts. Edge weights encode estimated transition costs between charts.
Abstract
We present GraphScape, a directed graph model of the visualization design space that supports automated reasoning about visualization similarity and sequencing. Graph nodes represent grammar-based chart specifications and edges represent edits that transform one chart to another. We weight edges with an estimated cost of the difficulty of interpreting a target visualization given a source visualization. We contribute (1) a method for deriving transition costs via a partial ordering of edit operations and the solution of a resulting linear program, and (2) a global weighting term that rewards consistency across transition subsequences. In a controlled experiment, subjects rated visualization sequences covering a taxonomy of common transition types. In all but one case, GraphScape’s highest-ranked suggestion aligns with subjects’ top-rated sequences. Finally, we demonstrate applications of GraphScape to automatically sequence visualization presentations, elaborate transition paths between visualizations, and recommend design alternatives (e.g., to improve scalability while minimizing design changes).
Materials
Citation