ACM Human Factors in Computing Systems (CHI), 2017
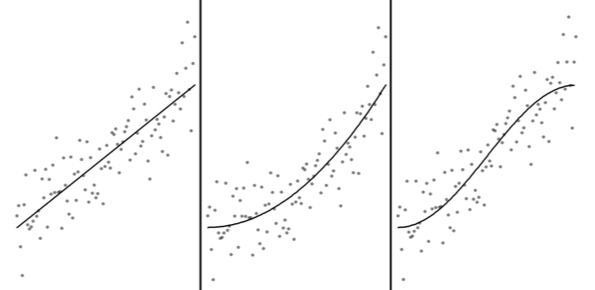
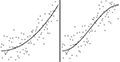
The three different trend types studied in this paper: linear, quadratic, and trigonometric trends. In Experiment 1, participants estimated the slope of the linear fits, curvature of the quadratic fits, and amplitude of the trigonometric fits. In Experiment 2, they estimated the y-intercept of these fits. In Experiment 3, they estimated only the slope of linear fits.
Abstract
Observing trends and predicting future values are common tasks for viewers of bivariate data visualizations. As many charts do not explicitly include trend lines or related statistical summaries, viewers often visually estimate trends directly from a plot. How reliable are the inferences viewers draw when performing such regression by eye? Do particular visualization designs or data features bias trend perception? We present a series of crowdsourced experiments that assess the accuracy of trends estimated using regression by eye across a variety of bivariate visualizations, and examine potential sources of bias in these estimations. We find that viewers accurately estimate trends in many standard visualizations of bivariate data, but that both visual features (e.g., "within-the-bar" bias) and data features (e.g., the presence of outliers) can result in visual estimates that systematically diverge from standard least-squares regression models.
Citation