ACM User Interface Software & Technology (UIST), 2011

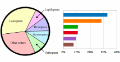
Example ReVision redesigns for input pie charts.
Abstract
Poorly designed charts are prevalent in reports, magazines, books and on the Web. Most of these charts are only available as bitmap images; without access to the underlying data it is prohibitively difficult for viewers to create more effective visual representations. In response we present ReVision, a system that automatically redesigns visualizations to improve graphical perception. Given a bitmap image of a chart as input, ReVision applies computer vision and machine learning techniques to identify the chart type (e.g., pie chart, bar chart, scatterplot, etc). It then extracts the graphical marks and infers the underlying data. Using a corpus of images drawn from the web, ReVision achieves an image classification accuracy of 96% across ten chart categories. It also accurately extracts marks from 79% of bar charts and 62% of pie charts, and from these charts it successfully extracts the data from 71% of bar charts and 64% of pie charts. ReVision then applies perceptually-based design principles to populate an interactive gallery of redesigned charts. With this interface, users can view alternative chart designs and retarget content to different visual styles.
Materials
Citation