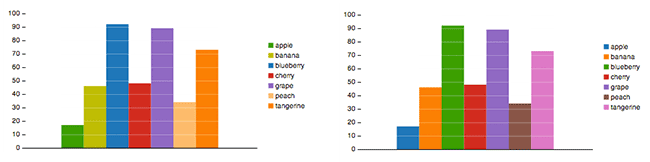
Bar charts depicting fictional fruit sales, each using the same backing color palette. The chart on the left uses our semantically-resonant assignment algorithm to pick colors that are representative of the data values. The chart on the right uses a default assignment that does not take color-concept associations into account.
Abstract
We introduce an algorithm for automatic selection of semantically-resonant colors to represent data (e.g., using blue for data about "oceans", or pink for "love"). Given a set of categorical values and a target color palette, our algorithm matches each data value with a unique color. Values are mapped to colors by collecting representative images, analyzing image color distributions to determine value-color affinity scores, and choosing an optimal assignment. Our affinity score balances the probability of a color with how well it discriminates among data values. A controlled study shows that expert-chosen semantically-resonant colors improve speed on chart reading tasks compared to a standard palette, and that our algorithm selects colors that lead to similar gains. A second study verifies that our algorithm effectively selects colors across a variety of data categories.