IEEE Trans. Visualization & Comp. Graphics (Proc. InfoVis), 2017
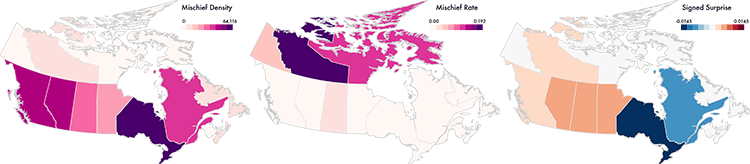
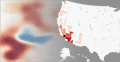
In this map of crime rates in Canada, the raw counts of the reported crime of “mischief” (leftmost image) gives the impression that the southern provinces are the most dangerous. The per-capita rate of crimes (center) gives the impression that the northern provinces are the most dangerous. This conflict can be resolved by modeling Bayesian Surprise rather than crime directly. The Surprise map (right) uses internal models of expectation to determine locations where crime is higher or lower than expected: Quebec and Ontario have lower than expected crime rates, while the Prairie Provinces have slightly more crime than would be expected given their population.
Abstract
Thematic maps are commonly used for visualizing the density of events in spatial data. However, these maps can mislead by giving visual prominence to known base rates (such as population densities) or to artifacts of sample size and normalization (such as outliers arising from smaller, and thus more variable, samples). In this work, we adapt Bayesian surprise to generate maps that counter these biases. Bayesian surprise, which has shown promise for modeling human visual attention, weights information with respect to how it updates beliefs over a space of models. We introduce Surprise Maps, a visualization technique that weights event data relative to a set of spatio-temporal models. Unexpected events (those that induce large changes in belief over the model space) are visualized more prominently than those that follow expected patterns. Using both synthetic and real-world datasets, we demonstrate how Surprise Maps overcome some limitations of traditional event maps.
Citation