IEEE Information Visualization (InfoVis), pp. 32-39, 2005
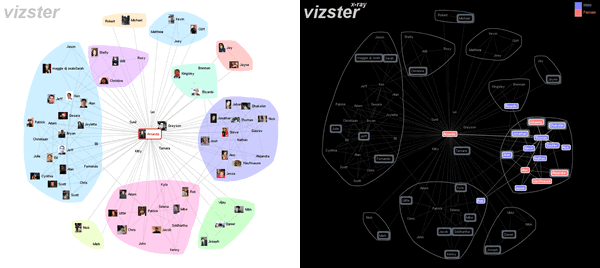
The Vizster social network visualization system. The view on the left shows a egocentric social network with the results of automated community analysis shown. The view on the right shows the system in "X-Ray" mode, where color is used to visualize values of a selected data attribute (in this case gender).
Abstract
Recent years have witnessed the dramatic popularity of online social networking services, in which millions of members publicly articulate mutual "friendship" relations. Guided by ethnographic research of these online communities, we have designed and implemented a visualization system for playful end-user exploration and navigation of large-scale online social networks. Our design builds upon familiar node-link network layouts to contribute customized techniques for exploring connectivity in large graph structures, supporting visual search and analysis, and automatically identifying and visualizing community structures. Both public installation and controlled studies of the system provide evidence of the system's usability, capacity for facilitating discovery, and potential for fun and engaged social activity.
Citation
Video