about
people
papers
video
code
blog
UW
Interactive
Data
Lab
Papers
Altair: Interactive Statistical Visualizations for Python
Jacob VanderPlas
,
Brian E. Granger
,
Jeffrey Heer
,
Dominik Moritz
,
Kanit Wongsuphasawat
,
Arvind Satyanarayan
,
Eitan Lees
,
Ilia Timofeev
,
Ben Welsh
,
Scott Sievert
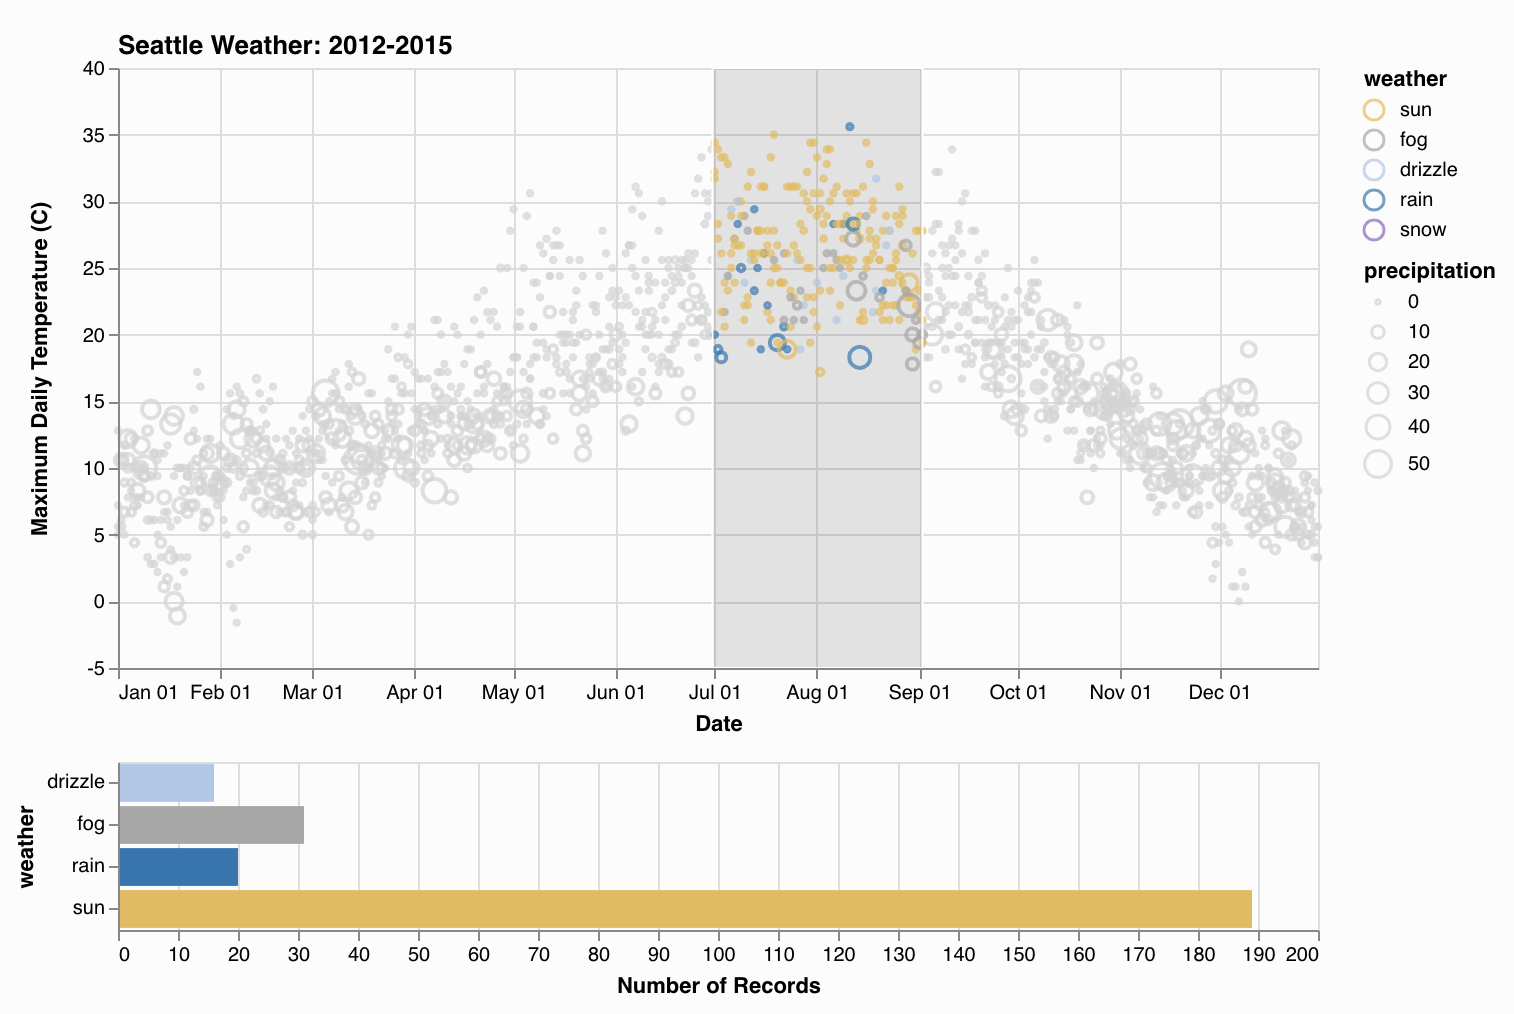
A chart supporting interactive exploration of Seattle weather over the course of a year. Brush selections along the x-axis allow viewers to easily see the distribution of weather types in a particular date range.
Materials
PDF
|
Journal
|
Software
|
BibTeX
Citation
Altair: Interactive Statistical Visualizations for Python
Jacob VanderPlas
,
Brian E. Granger
,
Jeffrey Heer
,
Dominik Moritz
,
Kanit Wongsuphasawat
,
Arvind Satyanarayan
,
Eitan Lees
,
Ilia Timofeev
,
Ben Welsh
,
Scott Sievert
The Journal of Open Source Software
,
3(32)
,
2018
PDF
|
Journal
|
Software