IEEE Trans. Visualization & Comp. Graphics (Proc. VIS), 2024
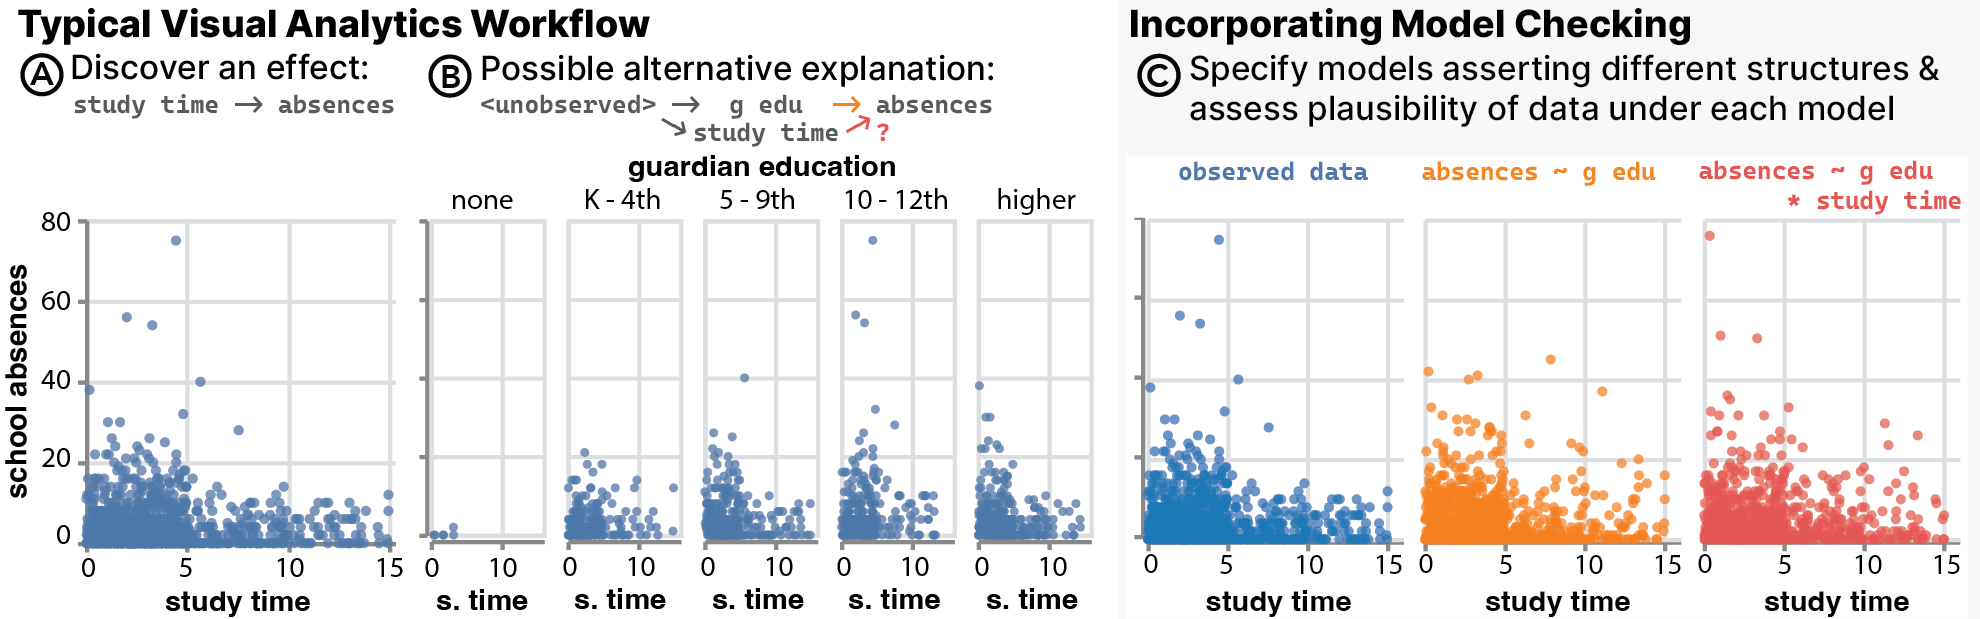
Model checks modify the typical visual analytics workflow by enabling users to assess the plausibility of interpretations of
discovered patterns. A⃝ The analyst discovers that accounting for time spent studying appears to help explain student absences. B⃝
The analyst facets this view by the highest level of education achieved by each student’s guardian. He wonders if study time is
predictive of absences after accounting for guardian education. C⃝ The analyst specifies models asserting that absences are explained
by either: guardian education alone (orange); or guardian education and study time (red). Seeing that predictions from the second
model do a better job of capturing the largest numbers of absences, he concludes that both guardian education and study time are
important explanatory variables.
Abstract
Visual analytics (VA) tools support data exploration by helping analysts quickly and iteratively generate views of data which
reveal interesting patterns. However, these tools seldom enable explicit checks of the resulting interpretations of data—e.g., whether
patterns can be accounted for by a model that implies a particular structure in the relationships between variables. We present EVM,
a data exploration tool that enables users to express and check provisional interpretations of data in the form of statistical models.
EVM integrates support for visualization-based model checks by rendering distributions of model predictions alongside user-generated
views of data. In a user study with data scientists practicing in the private and public sector, we evaluate how model checks influence
analysts’ thinking during data exploration. Our analysis characterizes how participants use model checks to scrutinize expectations
about data generating process and surfaces further opportunities to scaffold model exploration in VA tools.
Citation