IEEE Trans. Visualization & Comp. Graphics (Proc. VIS), 2024
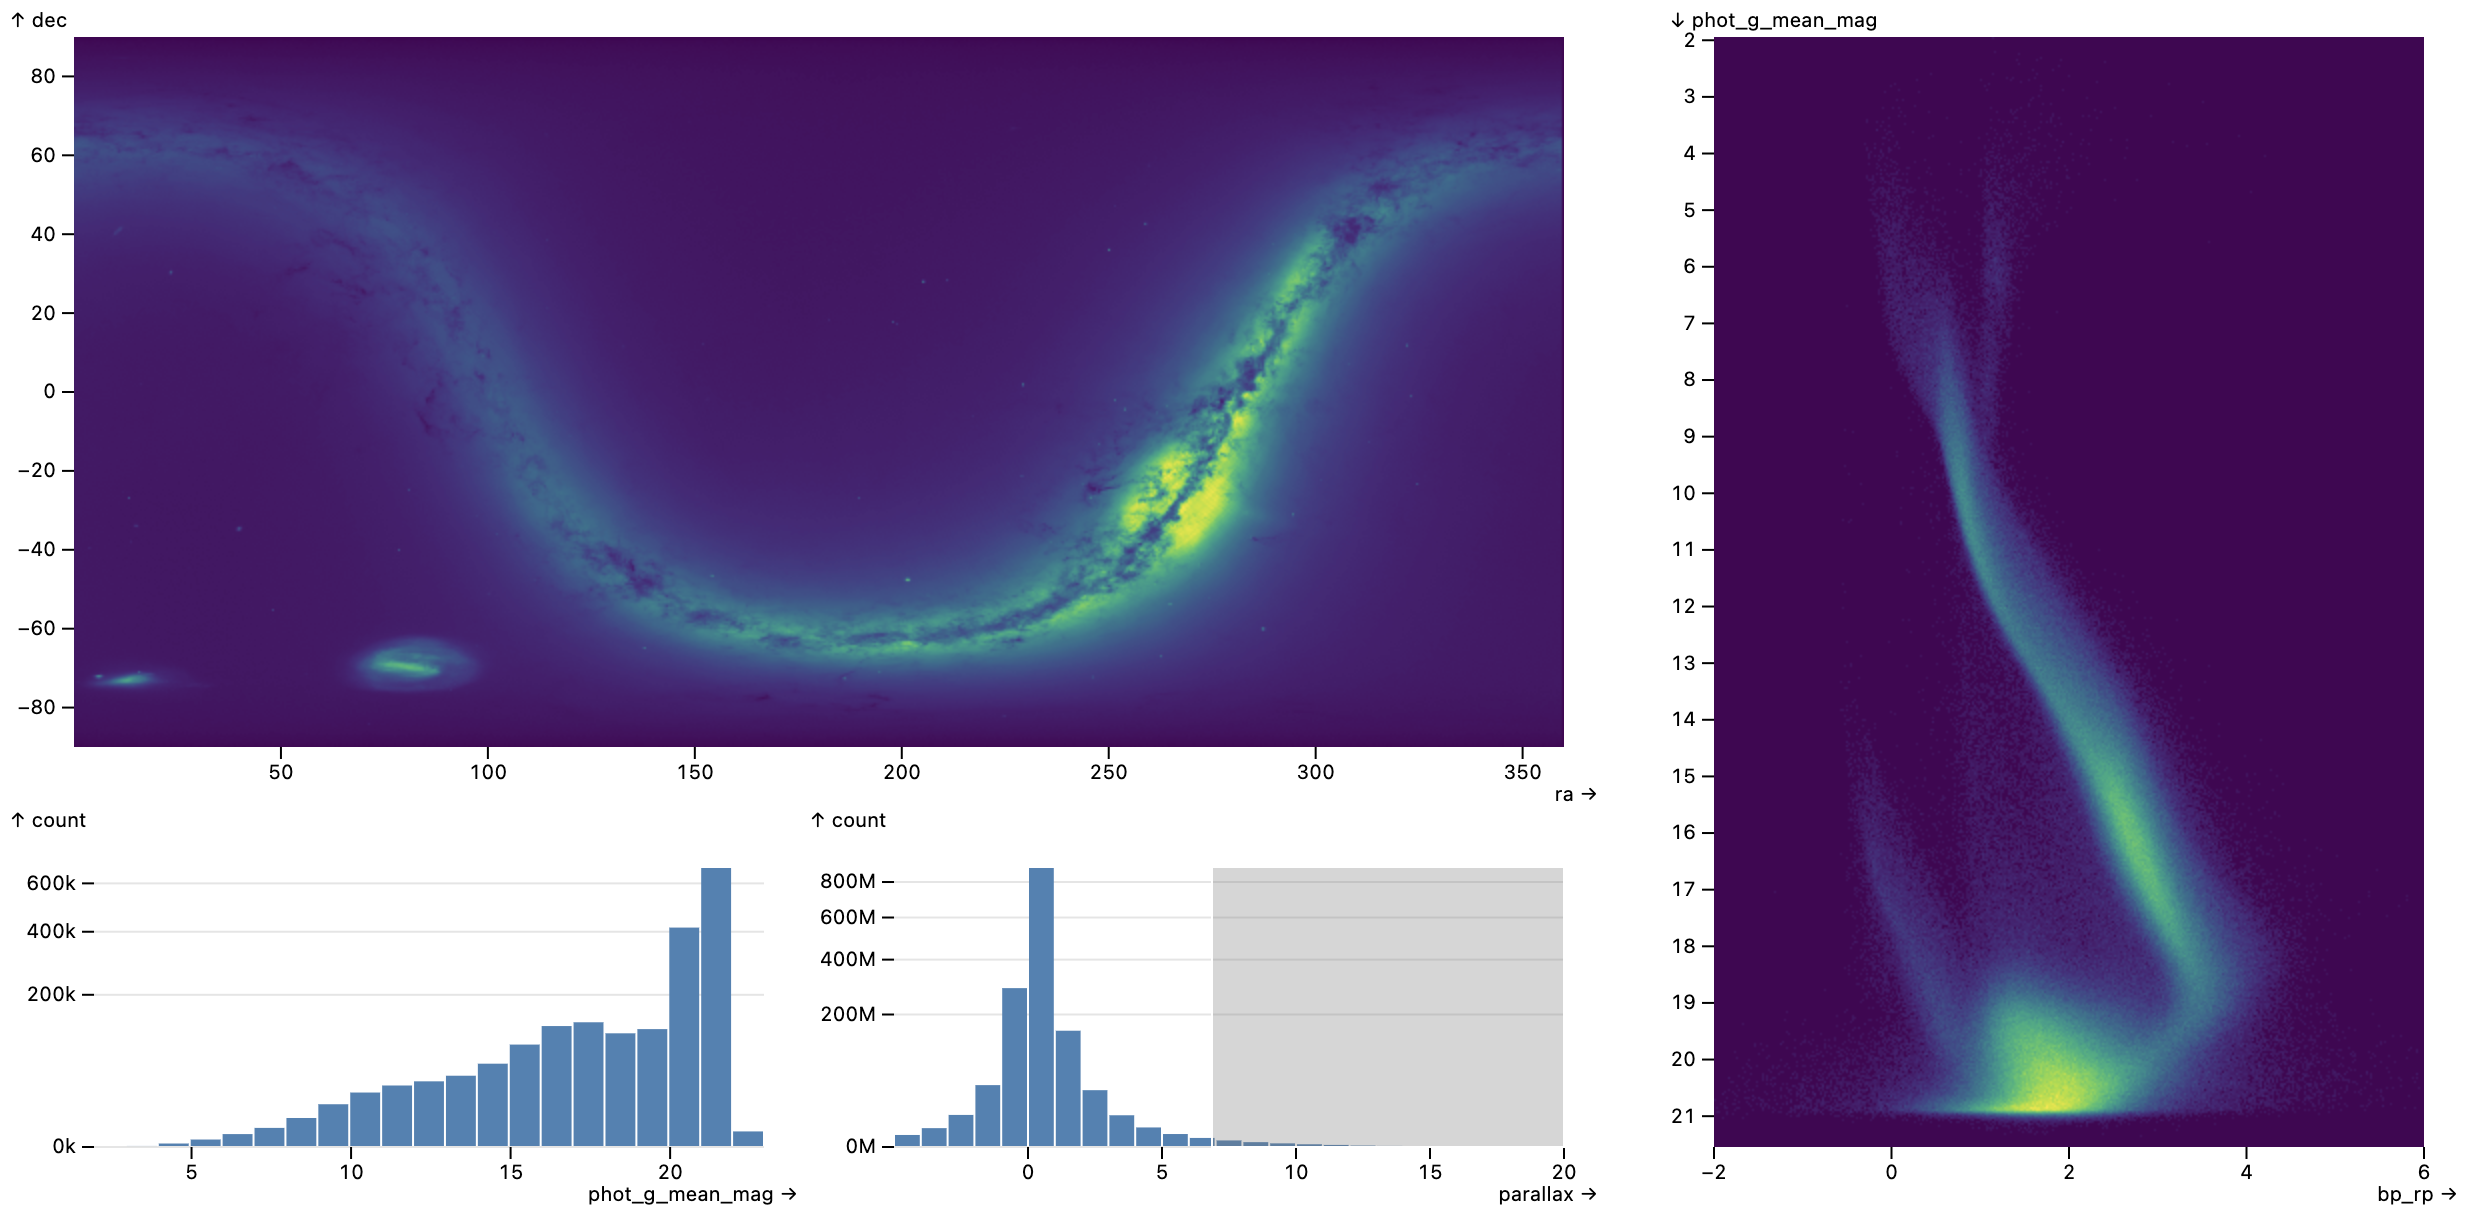
A Mosaic-based interface for interactive visual exploration of all 1.8 billion stars in the Gaia star catalog. A high-resolution density map of the sky reveals our Milky Way and satellite galaxies. Stars with higher parallax values are interactively selected, forming a Hertzsprung-Russell diagram of color versus stellar magnitude on the right. Mosaic offloads density and histogram computation to a backing scalable database, and automatically builds optimized data cube indexes to support interactive linked views.
Abstract
Mosaic is an architecture for greater scalability, extensibility, and interoperability of interactive data views. Mosaic decouples data processing from specification logic: clients publish their data needs as declarative queries that are then managed and automatically optimized by a coordinator that proxies access to a scalable data store. Mosaic generalizes Vega-Lite’s selection abstraction to enable rich integration and linking across visualizations and components such as menus, text search, and tables. We demonstrate Mosaic’s expressiveness, extensibility, and interoperability through examples that compose diverse visualization, interaction, and optimization techniques—many constructed using vgplot, a grammar of interactive graphics in which graphical marks act as Mosaic clients. To evaluate scalability, we present benchmark studies with order-of-magnitude performance improvements over existing web-based visualization systems—enabling flexible, real-time visual exploration of billion+ record datasets. We conclude by discussing Mosaic’s potential as an open platform that bridges visualization languages, scalable visualization, and interactive data systems more broadly.
Materials
Citation