Abstract
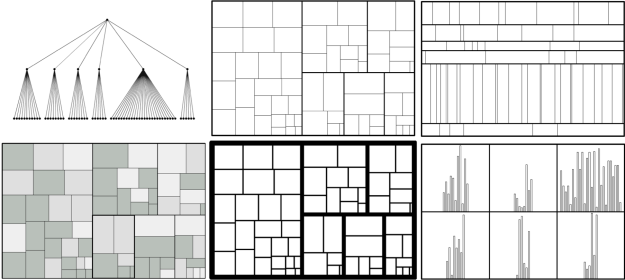
Treemaps are space-filling visualizations that make efficient use of limited display space to depict large amounts of hierarchical data. Creating perceptually effective treemaps requires carefully managing a number of design parameters including the aspect ratio and luminance of rectangles. Moreover, treemaps encode values using area, which has been found to be less accurate than judgments of other visual encodings, such as length. We conduct a series of controlled experiments aimed at producing a set of design guidelines for creating effective rectangular treemaps. We find no evidence that luminance affects area judgments, but observe that aspect ratio does have an effect. Specifically, we find that the accuracy of area comparisons suffers when the compared rectangles have extreme aspect ratios or when both are squares. Contrary to common assumptions, the optimal distribution of rectangle aspect ratios within a treemap should include non-squares, but should avoid extreme aspect ratios. We then compare treemaps with hierarchical bar chart displays to identify the data densities at which length-encoded bar charts become less effective than area-encoded treemaps. We report the transition points at which treemaps exhibit judgment accuracy on par with bar charts for both leaf and non-leaf tree nodes. We also find that even at relatively low data densities treemaps result in faster comparisons than bar charts. Based on these results, we present a set of guidelines for the effective use of treemaps.