IEEE VIS Short Papers, 2023
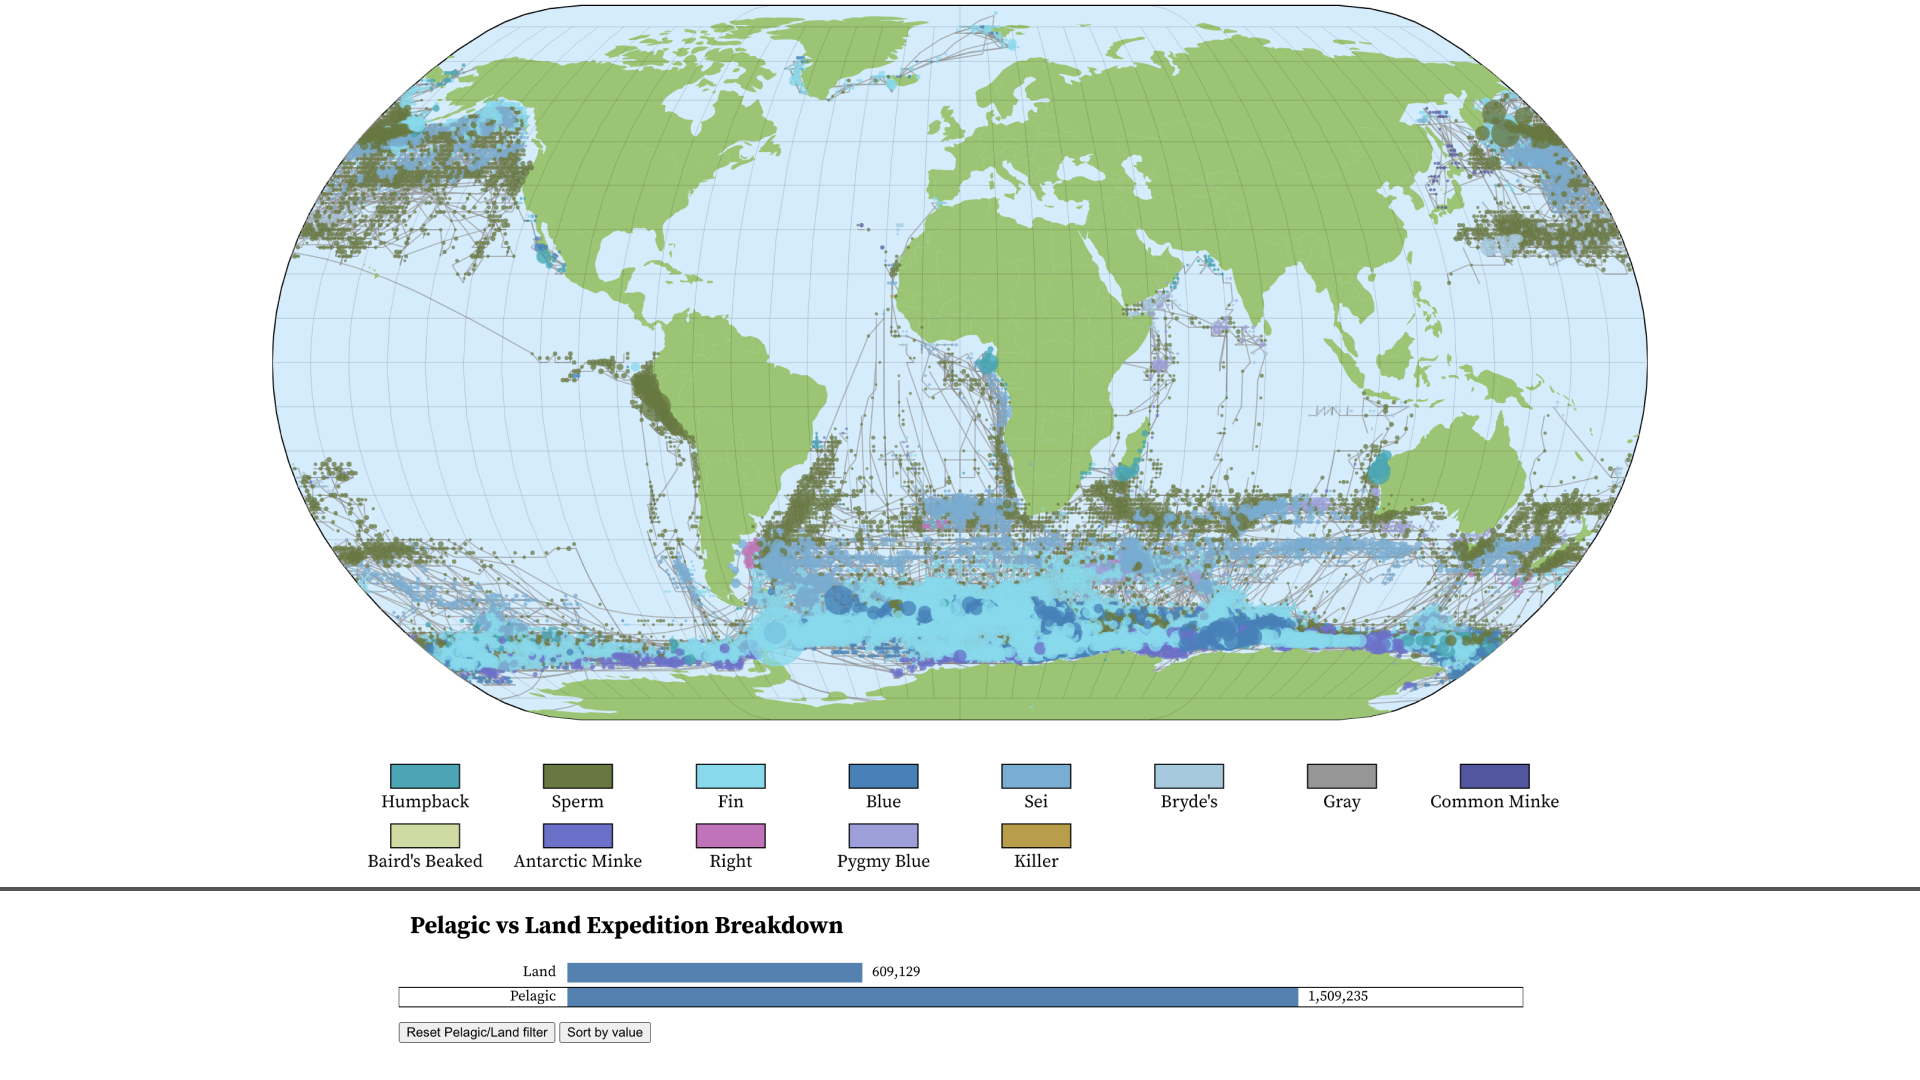
Selective visualizations from WhaleVis: The map visualization shows pelagic (offshore) whale catches and the routes traversed by whaling expeditions between 1880 and 1986. The bar chart shows the breakdown for pelagic vs land catches and also facilitates setting a filter for pelagic whale catches. The route density in the map visualization enables visual estimation of where whales were searched for. The North Atlantic and South Pacific Oceans have fewer catches than other regions. Since fewer expeditions traversed those waters, we are aware of a relative reduction in search effort when inferring the whale populations from reported catches in those regions.
Abstract
Whales are an important part of the oceanic ecosystem. Although historic commercial whale hunting a.k.a. whaling has severely threatened whale populations, whale researchers are looking at historical whaling data to inform current whale status and future conservation efforts. To facilitate this, we worked with experts in aquatic and fishery sciences to create WhaleVis—–an interactive dashboard for the commercial whaling dataset maintained by the International Whaling Commission (IWC). We characterize key analysis tasks among whale researchers for this database, most important of which is inferring spatial distribution of whale populations over time. In addition to facilitating analysis of whale catches based on the spatio-temporal attributes, we use whaling expedition details to plot the search routes of expeditions. We propose a model of the catch data as a graph, where nodes represent catch locations, and edges represent whaling expedition routes. This model facilitates visual estimation of whale search effort and in turn the spatial distribution of whale populations normalized by the search effort—a well known problem in fisheries research. It further opens up new avenues for graph analysis on the data, including more rigorous computation of spatial distribution of whales normalized by the search effort, and enabling new insight generation. We demonstrate the use of our dashboard through a real life use case.
Citation